Introduction to Industrial Engineering
By Jane M. Fraser
Chapter 10
Operations research and other mathematical methods
Return to the Table of Contents.
IEs, and other engineers, often want to perform experiments on real systems, but such experimentation can be difficult. If an IE wants to try a new layout for a production system, moving equipment, furniture, and offices would be difficult and time consuming. Even trying a new procedure may disrupt the production system. Therefore, the IE would create a model of the system, usually a mathematical model.
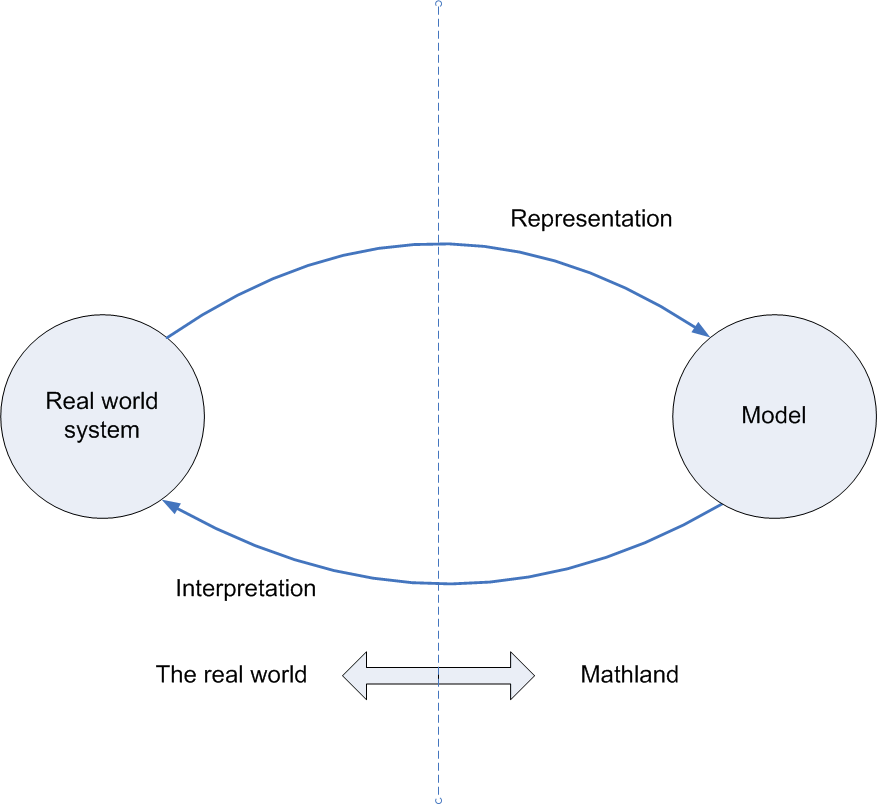
The following figure shows my favorite diagram.

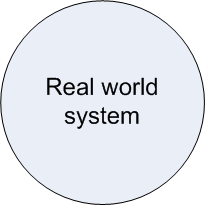
I'll now build the diagram, explaining each piece. The first circle is labeled “real world system.”

Drawing a line around some system involves deciding which parts are in your system and which are in the environment. For example, to study the arrival and service of customers at a bank, you would probably include the tellers, the drive up window, and the ATM, but not include the roads and traffic system that people use to get to the bank.

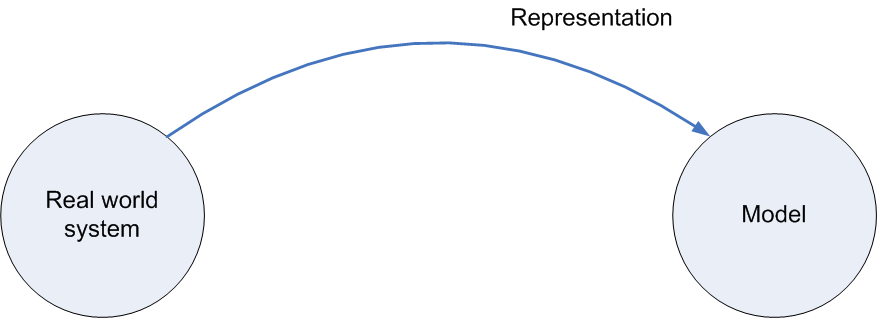
Now I’ve added the second circle, labeled “model.” Some types of engineers use physical models. For example, a civil engineer might place a scale model of a building on a shaking table to predict how the building will respond to an earthquake. IEs tend to use mathematical models, expressed in equations or sometimes in computer code. For example, an IE might use the mathematics of queuing theory to create a model of the bank.
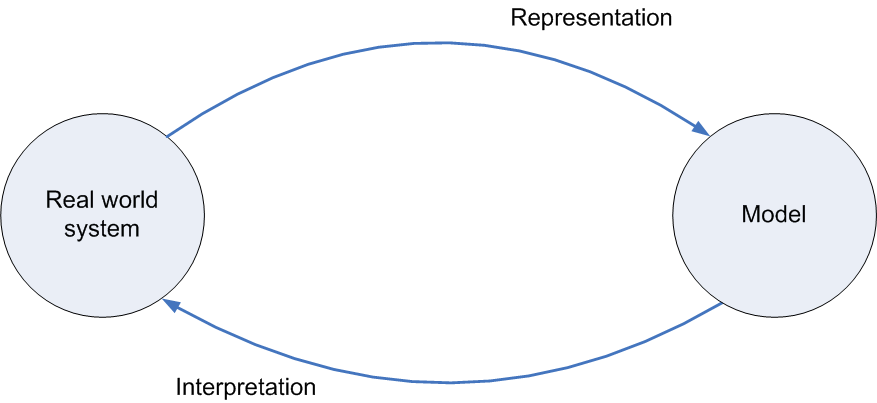
The top arrow labeled “representation” reminds us that the model represents the real world system -- but only the relevant parts of the system. Our model of the bank must include information on the time between customer arrivals and the time to serve each customer (both of these times vary from customer to customer), but the model doesn’t have to include descriptions of what color clothing customers wear. Depending on the purpose of our model it might include information on customer’s disabilities so we can predict how many teller windows must be accessible to people in wheelchairs. The M/M/1 queuing model describes the time between arrivals as an exponential random variable with average 1/&lambda (say 6 minutes) and the time of service as an exponential random variable with average 1/&mu (say 4 minutes).
A model is never exactly correct; you should always remember the phrase “it’s only a model.” For example, the M/M/1 queuing model assumes that customers arrive at the average rate 1 every 6 minutes, or 10 customers per hour. Actually, the arrival rate probably varies over the day.
An IE creates a model in order to extract information; the loop from the model to itself is labeled “analysis.” IEs use some models quite frequently and IEs can use mathematical results that others have proven. For example, for the M/M/1 queuing model, the average number of people in the queue is ...

The second line, labeled “interpretation,” is where the IE interprets the mathematical results of the model back to the real world system. Now the IE must again remember “it’s only a model” so the predictions may not be perfect. Since the M/M/1 queuing model assumes a constant average arrival rate, the results using &lambda = 10 customers per hour can only be applied to the period of the day with that arrival rate. A separate model might be needed for the lunch hour, which is probably busier.